A NUMBERS GAME:
A Review of the CDC Morbidity and Mortality Weekly Report 9/3/21

American Academy of Pediatrics parroting disgustingly biased data from a recent CDC MMWR.
Claiming the at-face-value alarming headline on 8/31/21 “Study: Myocarditis risk 37 times higher for children with COVID-19 than uninfected peers” in support of vaccinations for children.
Since this type of statistic is being used to: 1) counter recently published research articles stating the risk of myocarditis for children after vaccination, particularly the second shot; and 2) guide some health organizations and practicing healthcare providers to consider the benefits of the shot to outweigh the risks for children, I decided to dig into the numbers from the CDC data to uncover exactly from where and how they got this shocking number.

After another painful refresher on epidemiological statistics, multiple disturbing and blatantly biased issues with the CDC’s report became apparent. Their own admitted limitations discussed at the end of the study provide ample clues to these issues.
So onward to the dreaded math involved to back up the following statements.
Background of relevant statistics: Relative risk is a calculation that attempts to give a measure of strength of the association between exposure to some factor and the development of a disease. It is calculated by dividing the incidence in the exposed group by the incidence in the unexposed group. To get these numbers, it is necessary to make a table as follows:

The resultant answer from this calculation is interpreted as follows: If RR=1, risk in exposed equals risk in unexposed (no association); if RR>1, risk in exposed is greater than risk in unexposed (positive association, possibly causal); if RR<1, risk in exposed is less than risk in unexposed (negative association, possibly protective).
So filling in a table with their data from the <16 year old group:
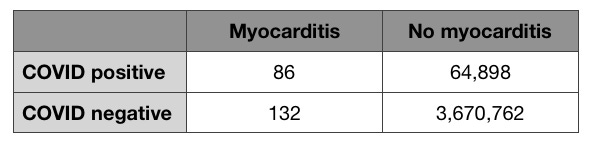
Substitute into the Relative Risk formula:
86÷(86+64,898)/132÷(132+3,670,762) = 36.8
Thus their claim that myocarditis risk is 37 times higher in children with COVID-19.
However, the problem is where they obtained the data to fill in this table, which brings us back to the bias within this CDC report.
Problem 1: The data is heavily inpatient data, meaning a significant number of patients were from hospital populations. It is well established that the generalizability of findings from hospital populations is subject to selection bias, as these patients are often among the sickest, most vulnerable in the population, making hospitalized patients not representative of an average general population. Indeed, one limitation explicitly stated in the study is:
“The findings represent a convenience sample of patients from hospitals reporting to PHD-SR and might not be generalizable to the U.S. population.”
Now depending on the condition, it is sometimes accepted and unavoidable to use this, especially when conditions are rare. I would highlight that while myocarditis is a rare condition, COVID-19 infection can hardly be considered rare in the U.S. over the past 18 months and the majority of cases have not resulted in a doctor visit or hospitalization, especially in children.
This leads to the preposterous fault I assert is in their use of data. How can we utilize 64,898 as the representative number of COVID positive cases without myocarditis in <16 year olds for an entire year nationwide to extrapolate incidence of exposed?! Especially when they have over 3.6 million as their number of COVID negative cases for that age group. Given that for kids COVID is most commonly asymptomatic or mild, the majority will not be seen in a clinic or emergency room or hospital floor, which is WHERE THESE CDC NUMBERS ARE FROM. This grossly over estimates the incidence of myocarditis in kids with COVID. I would argue by immense orders of magnitude. But as an illustrative exercise, let’s just say that in the communities surrounding these health systems an equal number of kids got COVID without myocarditis as didn’t get COVID during this time frame. Here’s the calculation again:
86÷(86+3,670,762)/132÷(132+3,670,762) = 0.65
Wow, now the risk of myocarditis is actually lower in kids with COVID. Let’s try ~1/3 of kids in those populations got COVID without myocarditis:
86÷(86+1,223,586)/132÷(132+3,670,762) = 1.95
So now the risk is less than 2 times greater. Not a whopping 37.
So it begs some questions. How can they make such a misleading overstatement? Why would an attempt not be made to capture a more accurate picture? Surely we could find the number of children <16 years old who tested COVID positive without myocarditis and didn’t require a doctor visit or hospitalization in the communities from which the data were obtained. Or at least a more adequate estimate. How can experts in their field flout common statistics so egregiously? It almost would seem to be intentionally limited in order to have a flashy number that supports a presupposed, preordained outcome. I would argue that these numbers are some of the most misleading, irrelevant, and useless out there. None-the-less gobbled up by the AAP.
Thus is a problem with statistics. The numbers can be fiddled with to support a conclusion. And the nitty, gritty details are so boring and laborious, that it is easy to capitalize on the fact that very few would like to analyze their analysis, especially when conclusions are for public consumption. Especially when we should be able to trust these entities. I would hardly expect anyone on the street to do this kind of auditing, but at big name, guiding, medical establishment bodies, I would expect some degree of fact checking and critical thinking. Isn’t that their explicit job? Especially before you make blanket decrees that have such potential impact. To say that I am disappointed with the CDC and AAP, among other “beacons” in medicine, is a gross understatement. This is the AAP whose motto is supposedly “Dedicated to the Health of All Children.” The outrage is nearly crippling.
I won’t dive into their other risk assessments, which may also be overestimating relative risk in other age groups for the same reasons. Garbage in, garbage out as they say.
Problem 2: The CDC admits in its assessments of the limitations of the study that they didn’t “ascertain” or exclude underlying medical conditions and alternative etiologies for myocarditis. It would seem that a report which has the word Morbidity in its name would, and more appropriately should, attempt to categorize comorbidities when analyzing the correlation or causation of a given condition or disease. Potential causes of myocarditis are vast and include autoimmune causes, drugs or toxins, rheumatic fever, Lyme disease, Kawasaki disease, and other common viruses like adenovirus (common cold), parvovirus B19, Epstein-Barr virus (“mono”), Enteroviruses, Herpes simplex virus to name a few. Were these voluntarily not excluded? It doesn’t say, but that these were not excluded is absurd and at minimum seriously weakens their suggested correlation. We do not find that which we fail to seek.
A statement that “myocarditis inpatient encounters were 42.3% higher in 2020 than in 2019,” certainly sounds bad. But then you look at the table with the dizzying columns of numbers and see that this amounts to only 1,255 more cases between the two years (4,560 cases in 2020 and 3,205 cases in 2019). Additionally, the source for this data (Premier Healthcare Database Special COVID-19 Release (PHD-SR)) is only estimated to account for around 20% of nationwide data. With myocarditis being a known rare condition to begin with (incidence of 10-20 per 100,000 per year and only 1-2 per 100,000 children per year in the U.S.), this means that using smaller data sets or population numbers can more significantly affect statistics.
So let’s extrapolate using the incidence rate for myocarditis. If the U.S. population is 331,449,281 (U.S. 2020 census), we can expect to see:
• between 33,144 to 66,289 cases of myocarditis per year in the general population
• between 3,314 to 6,628 cases of myocarditis per year in children
And if we use their case number of 4,560 as being from roughly 20% of nationwide data, this means the total expected cases of myocarditis for 2020 would be 22,800. This is far lower than the expected number of cases using incidence and US population to estimate. So it would appear that perhaps this does not amount to what they are implying.
Problem 3: Myocarditis cases were included based on “ICD-10-CM codes, which were not confirmed by clinical data (e.g., laboratory tests or cardiac imaging) and could be improperly coded or coded with a related condition (e.g., pericarditis).” Myocarditis is most often a suspected diagnosis, since the gold standard for definitive diagnosis requires a biopsy of the heart. This means that a constellation of typical symptoms with lab and imaging findings often makes the diagnosis. Given that myocarditis is a challenging diagnosis to make with nonspecific symptoms and lab findings, it would give more reliability to the numbers that define myocarditis cases if they used a standardized definition of what constitutes a myocarditis diagnosis for their report.
Talking point:
“Among patients with COVID-19, the first myocarditis encounter could have occurred during or after the first COVID-19 health care encounter.”
Up to more than 2 months afterward. The majority (89.6%) were within one month. But hundreds were greater than one month out. This is not so much a critique of the report but highlights the question, “In assessing the risks for myocarditis after vaccination, for clinical trials or research papers, should we extend the surveillance/inclusion criteria up to at least 2 months or more to attribute as potentially vaccine associated?” Since this is how the CDC wants to correlate such findings.
Problem 4: They acknowledge a bias towards “underascertainment” of COVID-19 cases to possibly bias risk analysis found among 25-39 year olds, but in the direction of bringing it closer to no true association. So they bother to posit an explanation when one set of data doesn’t jive:
"In this study, the association between COVID-19 and myocarditis was lowest for persons aged 25–39 years and higher among younger (<16 years) and older (≥50 years) age groups, a pattern that has not been previously described in age-stratified analyses and that warrants further investigation. This finding might be partially explained by age-related differences in COVID-19 case ascertainment, because younger adults with less severe disease might be less likely than older adults to have a health care encounter with a COVID-19 diagnosis captured within PHD-SR. This age-related differential misclassification (underascertainment) of COVID-19 status might bias risk differences and risk ratios toward the null more for younger adults and could partially explain the observed age-related association.”
However these very acknowledgements are not applied to the conclusions about the risk in children <16 years old (See Problem 1)!! Not a peep of acknowledgement. The verbatim facts (from above excerpt) that “age-related differences in COVID-19 case ascertainment” can be seen because those “younger <adults> with less severe disease might be less likely than older adults to have a health care encounter with a COVID-19 diagnosis captured within PHD-SR” precisely underlies the faulty data analysis for the concluded risk in children <16 years old. This blind spot or omission is Earth shattering in magnitude.
And yet the AAP doesn’t even take the time apparently to vet these claims. The CDC MMWR report was published as “Early release” on 8/31/21 and the AAP publication was put out the same day. Have we gotten that trusting? That lazy? That potentially corrupt?
Where the numbers and research will lead us, I do not know. No one does at this point. But I do know that we should not be using such skewed, flawed data to make sweeping proclamations. It’s too early. Especially when this same condition appears to result from vaccines meant to “protect” from the infection. In either scenario, myocarditis in children is not to be taken lightly. “Children diagnosed with acute myocarditis have only a 60% likelihood of transplantation-free survival at 10 years.”1,2 Translation? Within 10 years from diagnosis, 40% require heart transplant or die. Caution has been thrown to the wind and I fear the consequences.
As a cog in the healthcare system, my voice feels meek. But after discovering these glaring biases, I couldn’t not speak out. As I have largely abstained from social media until recent months, my circle of influence online is limited. My goal is to pass such a finding along to others with bigger megaphones. We’re all on the side of team truth. Think of this as an alley-oop or assist so that this can reach further. If you think this is as outrageous as I do, please look for yourself, double check what I’ve reported, challenge what I’ve reported. But if you come to similar conclusions, please use every avenue to expose this bastardization of “science.”
~Pebble in the pond
References:
Pollack, A., Kontorovich, A., Fuster, V. et al. Viral myocarditis—diagnosis, treatment options, and current controversies. Nat Rev Cardiol12, 670–680 (2015). https://doi.org/10.1038/nrcardio.2015.108
Towbin JA, Lowe AM, Colan SD, et al. Incidence, Causes, and Outcomes of Dilated Cardiomyopathy in Children. JAMA. 2006;296(15):1867–1876. doi:10.1001/jama.296.15.1867
United States Census Bureau. Accessed online 9/14/21. https://www.census.gov/quickfacts/fact/table/US/POP010220
Celentano, David D. & Szklo, Moyses. Gordis Epidemiology, Sixth Edition. Elsevier, 2019.
American Heart Association. Viruses are the most common cause of myocarditis in children, experts offer guidance. July 7, 2021. Accessed online 9/14/21. https://newsroom.heart.org/news/viruses-are-the-most-common-cause-of-myocarditis-in-children-experts-offer-guidance
Cooper, Jr., Leslie T. Clinical manifestations and diagnosis of myocarditis in adults. UpToDate. Accessed online 9/14/21.
Allan, Catherine K. & Fulton, David R. Clinical manifestations and diagnosis of myocarditis in children. UpToDate. Accessed online 9/14/21.
Thank you! This is great information and easily digestible by lay persons. I really feel that people are waking up to what’s going on and desire to understand the science, but don’t have the requisite skill set. And my child will NEVER be vaccinated- she is very healthy & had Covid for about 2 hours (slight fever - took a nap & gone - anosmia a few days later). She was never tested so no stats on her. I really fear for these kids who get myocarditis & the parents that allow it to happen out of abject fear.